NEW YORK, March 27, 2014 /PRNewswire/ — XO Group Inc. (NYSE: XOXO), a global media and technology leader and creator of the top wedding website TheKnot.com, today released the results of its annual Real Weddings Study. This comprehensive report surveyed nearly 13,000 US brides and grooms married in 2013. TheKnot.com 2013 Real Weddings Study captures detailed information on the average cost of a wedding, average number of wedding guests, wedding style trends and other key statistics related to weddings in America.
“Wedding budgets have been increasing steadily since the economic downturn of 2008, and in 2013, couples spent a record high average of nearly $30,000,” said Carley Roney, cofounder of The Knot. “Couples are spending more on things like outdoor wedding venue Virginia and entertainment as they are more focused than ever on creating a unique, personalized and once-in-a-lifetime experience for their guests – plus they’re doing so in a modern way, by planning from their smartphones, publicizing details on social media and more.”
Top 2013 Wedding Statistics
- Average Wedding Cost: $29,858 (excludes honeymoon)
- Most Expensive Place to Get Married: Manhattan, $86,916 average spend
- Least Expensive Place to Get Married: Idaho, $16,159 average spend
- Average Spent on a Wedding Dress: $1,281
- Average Marrying Age: Bride, 29; Groom, 31
- Average Number of Guests: 138
- Average Number of Bridesmaids: 4 to 5
- Average Number of Groomsmen: 4 to 5
- Most Popular Month to Get Engaged: December (16%)
- Average Length of Engagement: 14 months
- Most Popular Month to Get Married: June and September (15% each)
- Popular Wedding Colors: Blue (35%), Purple (26%), Pink (25%), Metallics (25%)
- Percentage of Destination Weddings: 24%
Top 2013 Wedding Trends
GROWING BUDGETS. Couples are spending more on their weddings than ever. Following the trend of growing budgets for the past two years, wedding budgets are at an all-time high with the average wedding cost hitting $29,858, the highest level ever. Less couples (20%) say the economy affected their wedding budget – a statistic that has continually decreased year over year, since reaching an all-time high of 34% in 2009. Wedding standards also continue to rise, in fact, about 1 in 8 couples (14%) spent more than $40,000 on their nuptials, and nearly 1 in 4 (24%) didn’t even have a budget. From choosing exotic locations for the wedding, to setting out the best food for guests, to picking an experienced wedding photography Cape Cod team, couples are ready to make every effort for the perfect wedding – money no constraint.
GUESTS CONQUER ALL. Couples are concentrating on creating an experience for guests. Not only did spend per guest increase to $220, up nearly $26 per guest from 2009 when couples spent $194 per guest, but guest entertainment continues to gain popularity. This rapidly rising category only continues to grow – in 2013, nearly 1 in 3 couples (30%) provided additional guest entertainment, compared with just 11% in 2009. Additionally, while the number of brides who throw a rehearsal dinner, after-party or morning-after brunch has remained steady, brides are spending more money on these events. In 2013, brides spent an average of $1,184 on their rehearsal dinners (up from $1,135 in 2012) and $457 on their morning-after brunch (up from $429 in 2012).
TRADITIONS CONTINUE TO EVOLVE. Couples are foregoing some traditions to modernize their nuptials. Couples are becoming more liberal in their prewedding lifestyles; nearly 3 in 4 couples (74%) now opt to live together prior to getting married. Casual weddings are also on the rise, with 17% of brides classifying their weddings as casual in 2013, up from 12% in 2008. Along the same lines, couples aren’t marrying in religious institutions as much as they used to; just 33% chose to do so in 2013, down from 41% in 2009. While the majority of brides still opt to take their spouse’s last name (80%), this tradition is becoming less popular, down from 2009 when a whopping 86% changed their last names. Similarly, 1 in 10 (10%) brides kept their names in 2013, up from just 7% of brides who chose to do so in 2009.
SEASONAL SHIFTS. Summer is slowly making its way out of style as the wedding season. Summer is generally defined as wedding season, however, the trend toward beautiful summer weddings is shifting. In 2013, 35% of couples opted for sunshine-filled nuptials, down from 2009 when 41% of couples opted for the season. In recent years, fall has been making headway as the “new” wedding season, but the rise of fall weddings is pausing. In 2013, 32% of couples chose the season, down from its high of 36% in 2011. Spring is gaining traction with couples who aren’t afraid of April showers; 26% of brides chose pretty spring weddings, up from 22% in 2011. Winter is also coming from behind to give couples gorgeous snow-filled portraits; though still the minority, 7% of couples chose a winter wedding in 2013, up from 5% in 2012.
PERSONALIZATION AT A PEAK. Weddings are the ultimate form of self-expression. The trend in weddings for many years has been to create a personalized experience, where the couples’ personalities are evident in many areas of the wedding. This trend is on the rise, with couples opting for unique details like signature wedding cocktails, which 20% of couples had, up from just 12% in 2008, and hosting interactive food stations (15% of weddings in 2013, up from 13% in 2010). Couples are also personalizing their ceremonies into unique, touching experiences with a family member or friend officiating – just 57% of couples hired a professional ceremony officiant, down from 63% of couples who did so in 2009. Couples are spending more money on photographers too, to ensure they have lots of beautiful pictures of their special day. If you’re looking for a photographer, visit olgatopchii.com click here to read.
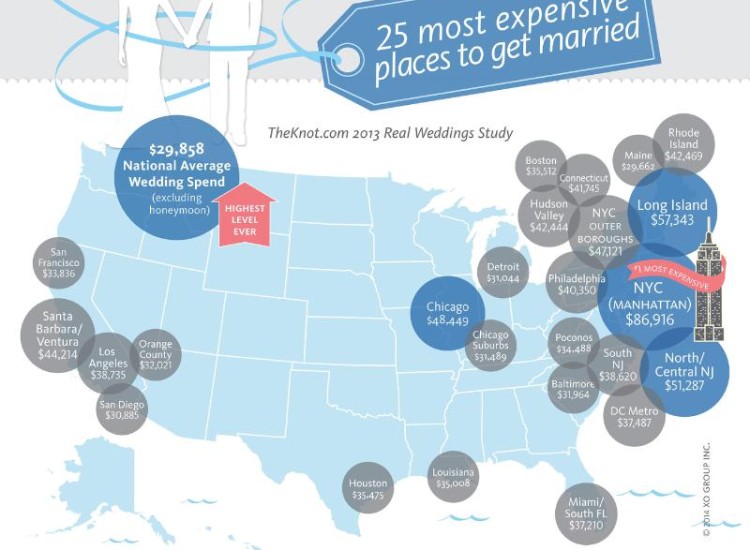
Top 25 Most Expensive Places to Get Married
Based on average cost of a wedding in 2013, couples spend the most on their weddings in the following areas in US.
- New York City (Manhattan): $86,916
- Long Island: $57,343
- North/Central New Jersey: $51,287
- Chicago: $48,449
- NYC Outer Boroughs: $47,121
- Santa Barbara/Ventura, CA: $44,214
- Rhode Island: $42,469
- Westchester/Hudson Valley, NY: $42,444
- Connecticut: $41,745
- Philadelphia: $40,350
- Los Angeles: $38,735
- South New Jersey: $38,620
- Washington, DC/Northern Virginia/suburban Maryland: $37,487
- Southern Florida (Miami, Fort Lauderdale and surrounding areas): $37,210
- Boston: $35,512
- Houston: $35,475
- Louisiana: $35,008*
- Lehigh Valley/Poconos, PA: $34,488*
- San Francisco: $33,836
- Orange County/Inland Empire, CA: $32,021
- Baltimore: $31,964
- Chicago Suburbs, IL: $31,489*
- Detroit: $31,044*
- San Diego: $30,885
- Maine: $29,854*
*New to Top 25 List in 2013
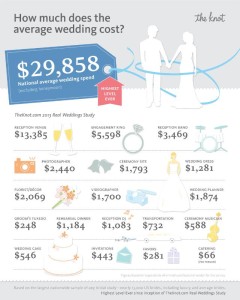
2013 Average Wedding Budget Breakdown
| Category | 2013 National Average Spend | 2012 National Average Spend |
| Overall Wedding (excluding honeymoon) | $29,858 | $28,427 |
| Venue (reception hall) | $13,385 | $12,905 |
| Photographer | $2,440 | $2,379 |
| Wedding/Event Planner | $1,874 | $1,847 |
| Reception Band | $3,469 | $3,084 |
| Reception DJ | $1,038 | $988 |
| Florist/Decor | $2,069 | $1,997 |
| Videographer | $1,700 | $1,619 |
| Wedding Dress | $1,281 | $1,211 |
| Groom’s Tuxedo | $248 | $230 |
| Wedding Cake | $546 | $560 |
| Ceremony Site | $1,793 | $1,711 |
| Ceremony Musicians | $588 | $554 |
| Invitations | $443 | $453 |
| Limousine | $732 | $708 |
| Favors | $281 | $289 |
| Rehearsal Dinner | $1,184 | $1,135 |
| Engagement Ring | $5,598 | $5,431 |
| Catering (price per person) | $66 | $63 |
| Officiant | $260 | $246 |
| Figures based on respondents who hired a professional vendor for the service. | ||
Notable Regional Differences
TheKnot.com 2013 Real Weddings Survey can be broken down on a region-by-region basis across more than 80 markets. Regional highlights include:
- Cost of Weddings: New York City (Manhattan) and Long Island have the highest average wedding spend ($86,916 and$57,343, respectively), and Utah and Idaho brides had the lowest average wedding spend ($16,816 and 16,159 respectively), excluding honeymoon.
- Marriage Age: The NYC Outer Boroughs and Nevada have the oldest brides (33.1 and 32.3 years respectively), whereasUtah and West Texas have the youngest brides (25.7 and 26.7 years), on average.
- Engagement Length: Idaho and Rhode Island brides have the longest engagements (21.8 and 20.3 months respectively), while brides in Wyoming and Utah have the shortest (10.5 and 10.6 months), on average.
- Wedding Size: On average, Nebraska and Iowa brides have the largest number of wedding guests (222 and 195 respectively), and Nevada and Hawaii brides still have the smallest number of wedding guests (63 and 81).
- Wedding Style: Savannah, GA, and Hawaii have the most casual weddings (41% and 38% respectively), while Manhattanand North/Central NJ had the most formal (black-tie) weddings (40% and 35% respectively).
- Wedding Dress Spend: Brides in Manhattan and Long Island, NY, spend the most on their dresses ($3,027 and $2,160respectively), while Alaskan and Oklahoman brides spend the least ($804 and $859 respectively).
- Honeymoon: Couples from West Virginia (89%), Utah (88%) and Tennessee (88%) are most likely to book a honeymoon, while couples in Alaska and Nevada are still least likely to honeymoon (43% and 44% respectively).
- Gift Registry: Brides in Iowa and Nebraska are the most likely to register for wedding gifts (98% and 97% respectively), while brides in Hawaii and Nevada are least likely to register (62% and 69% respectively).
About TheKnot.com 2013 Real Weddings Survey
The 2013 Real Weddings Survey captured responses from nearly 13,000 US brides married between January 1 and December 31, 2013. Respondents were recruited throughout the year from TheKnot.com and WeddingChannel.commembership, which represents nearly 80% of brides nationwide. Brides received survey invitations shortly after their wedding date and were asked a comprehensive series of questions about the event and their planning process. All qualified respondents attested that they:
- Were 18 or older
- Had a wedding in 2013
Survey respondents represent a variety of ethnicities and educational and income levels, and are geographically dispersed across the country. The survey and data management partner for the study was Decipher Inc.






Join the Conversation →