“In 2011, budgets increased for the first time since the economic downturn, and this past year, in 2012, we saw that wedding budgets are continuing to rise even more and to an all-time high since 2008,” said Carley Roney , cofounder of The Knot. “Couples are increasingly less concerned with the economy and are comfortable investing more than ever in the once-in-a-lifetime experience of planning their wedding and making it a fabulous experience for their guests.” With ever-increasing costs, it is absolutely paramount that couples save appropriately prior to the big day. Ways to do this include visiting car insurance comparison sites, similar to Money Expert, to make sure you are not paying an excessive amount for what you receive.. The savings can go towards making your wedding more affordable.
Couples looking to make their wedding day unforgettable and who are willing to push the boat out might want to seriously consider a French Chateau Wedding. Intimate or large, Chateau Bouffemont can cater to weddings of any scale in their wonderful venue. It must be seen to be believed, this truly is a dream venue.
In the UK, a stunning venue is the Daffodil Hotel and Spa: the best wedding venue in the Lake District. If you are looking for a wedding venue with a real wow factor then The Daffodil is ideal for you.
2012 Wedding Statistics
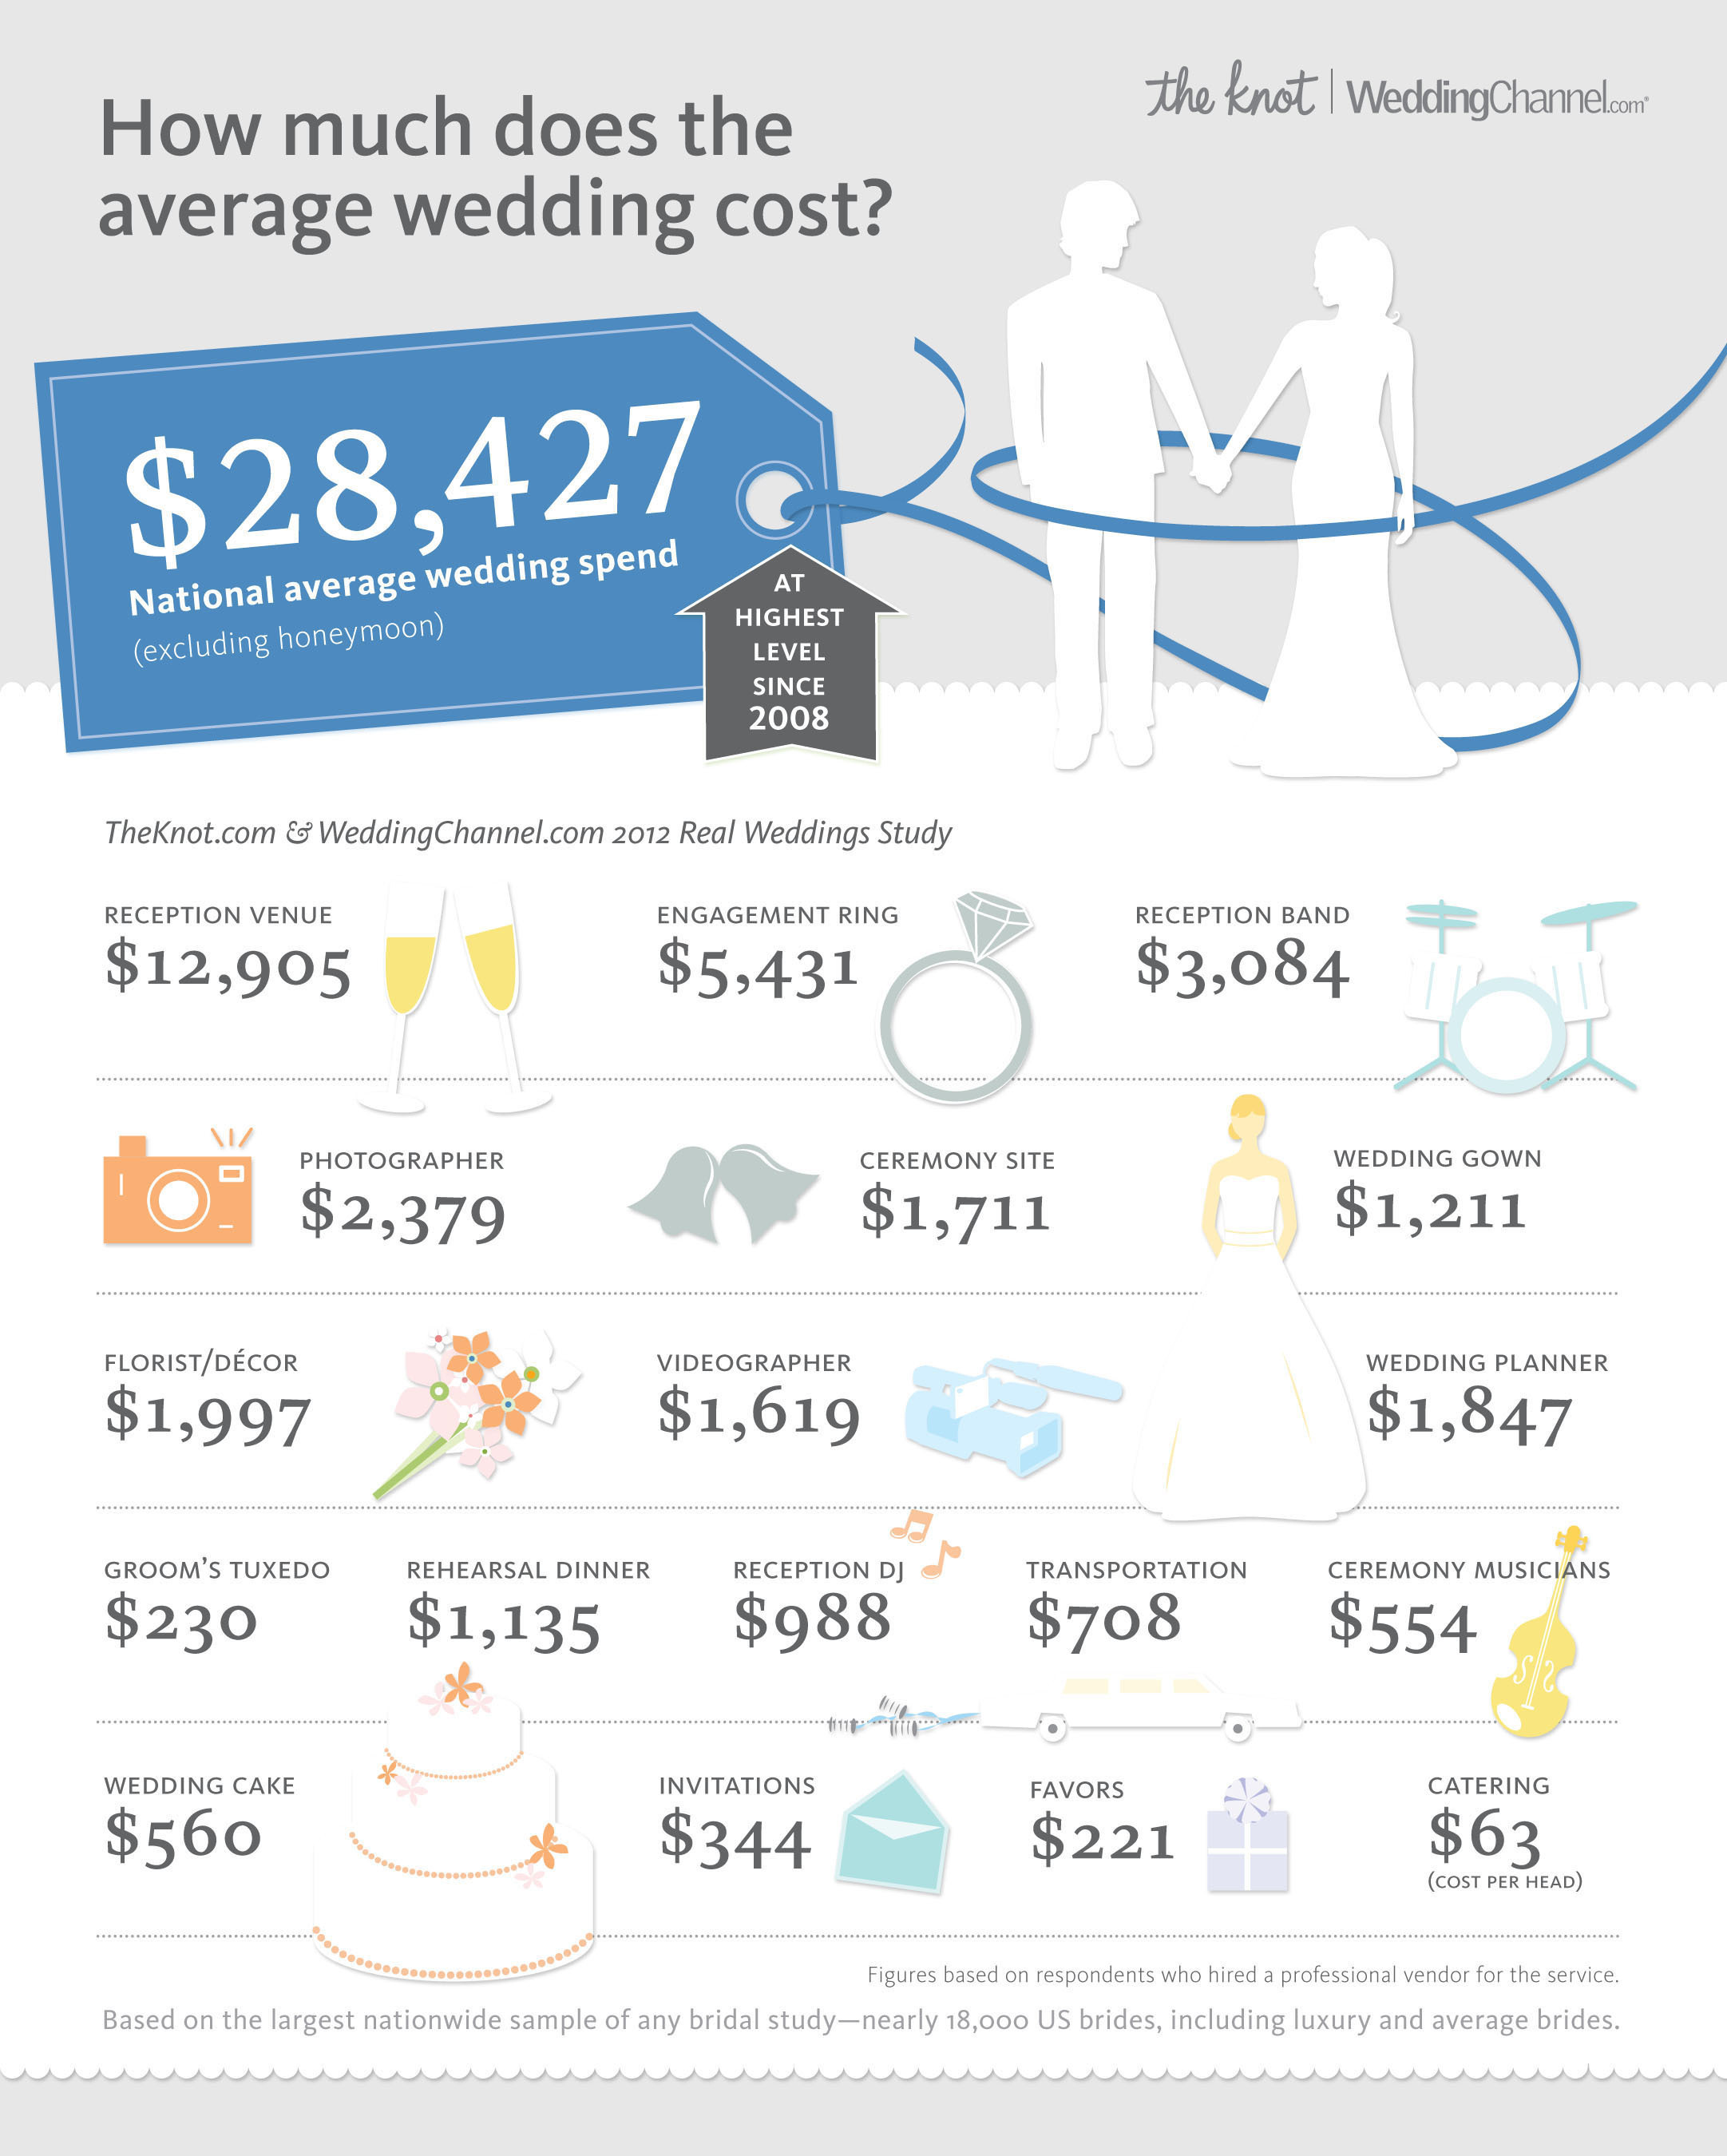
- Average Wedding Budget: $28,427 (excludes honeymoon)
- Most Expensive Place to Get Married: Manhattan, $76,678 average spend
- Least Expensive Place to Get Married: Alaska, $15,504 average spend
- Average Spent on a Wedding Dress: $1,211
- Average Marrying Age: Bride, 29; Groom, 31
- Average Number of Guests: 139
- Average Number of Bridesmaids: 4 to 5
- Average Number of Groomsmen: 4 to 5
- Most Popular Month to Get Engaged: December (16%)
- Average Length of Engagement: 14 months
- Most Popular Month to Get Married: June (17%)
- Popular Wedding Colors: Blue (33%), Purple (26%), Green (23%), Metallics (23%)
- Percentage of Destination Weddings: 24%
2012 Average Wedding Budget Breakdown
| Category | 2012 National Average Spend | 2011 National Average Spend |
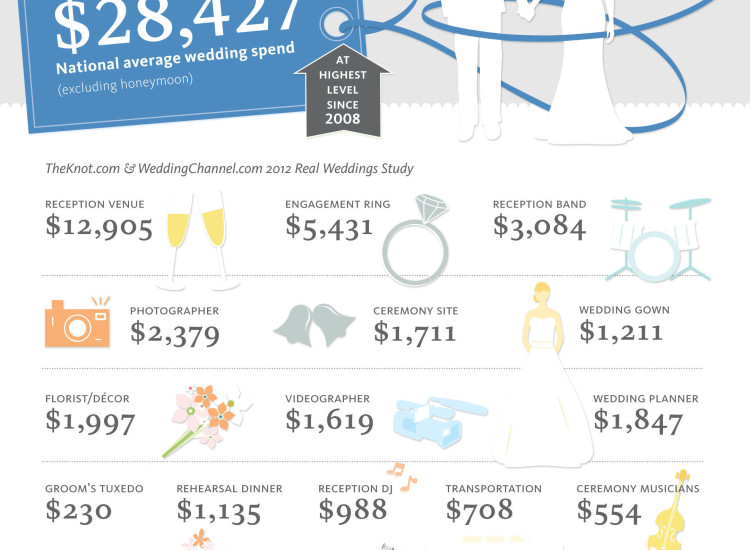
| Overall Wedding (excluding honeymoon) | $28,427 | $27,021 |
| Venue (reception hall) | $12,905 | $12,116 |
| Photographer | $2,379 | $2,299 |
| Wedding/Event Planner | $1,847 | $1,753 |
| Reception Band | $3,084 | $3,122 |
| Reception DJ | $988 | $929 |
| Florist/Decor | $1,997 | $1,894 |
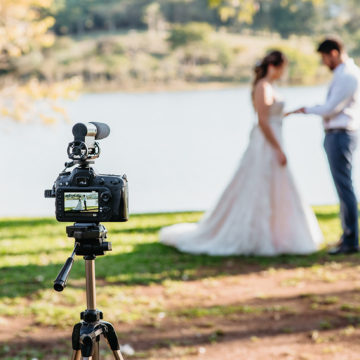
| Videographer | $1,619 | $1,486 |
| Wedding Dress | $1,211 | $1,121 |
| Groom’s Tuxedo | $230 | $215 |
| Wedding Cake | $560 | $535 |
| Ceremony Site | $1,711 | $1,599 |
| Ceremony Musicians | $554 | $536 |
| Invitations | $453 | $440 |
| Limousine | $708 | $669 |
| Favors | $289 | $285 |
| Rehearsal Dinner | $1,135 | $1,078 |
| Engagement Ring | $5,431 | $5,130 |
| Catering (price per person) | $63 | $61 |
| Figures based on respondents who hired a professional vendor for the service. |
Top 20 Most Expensive Places to Get Married
Based on average wedding spend in 2012, these are the areas around the US where couples spend the most on their weddings.
- New York City (Manhattan): $76,687
- Chicago, IL: $49,810
- New York Metro (Long Island, Hudson Valley and NYC Outer Boroughs): $49,002, $46,300, $39,602
- Northern/Central New Jersey and Southern New Jersey: $48,496, $35,375
- Rhode Island: $47,399
- Santa Barbara/Ventura, CA: $42,319
- Boston, MA: $39,239
- Philadelphia, PA: $38,369
- Connecticut: $38,009
- San Francisco, CA: $35,344
- Los Angeles, CA: $35,308
- San Diego and Orange County/Inland Empire, CA: $34,136, $33,848
- Baltimore, MD: $33,366
- Washington, DC/Northern Virginia/suburban Maryland: $33,118
- Houston, TX: $31,978
- Southern Florida (Miami, Fort Lauderdale and surrounding areas): $31,288
- Savannah, GA: $30,618*
- Sacramento/Reno/Tahoe: $30,458*
- Hawaii: $29,636
- Illinois: $29,489*
*New to Top 20 List in 2012
Notable Regional Differences
TheKnot.com & WeddingChannel.com 2012 Real Weddings Survey can be broken down on a region-by-region basis across more than 80 markets. Regional highlights include:
- Budget: New York City (Manhattan) has the highest average wedding budget ($76,687), and Alaska brides has the lowest average wedding budget ($15,504), excluding honeymoon.
- Age: Hawaii has the oldest brides (33 years), whereas Utah has the youngest brides (25 years), on average.
- Engagements: Middle Atlantic brides have the longest engagements (15.8 months), while brides in East South Central have the shortest (11.9 months), on average.*
- Wedding Size: On average, Utah brides still have the largest number of wedding guests (209), and Nevada brides still have the smallest number of wedding guests (64).
- Wedding Style: Wyoming has the most casual weddings (39%), while Chicago, IL, has the most formal (black-tie) weddings (44%).
- Wedding Dress Spend: Brides in Manhattan spend the most on their dresses ($2,877 on average), while Idaho brides spend the least ($878).
- Honeymoon: Savannah, GA, Couples are most likely to book a honeymoon (90%), while Alaskan couples are least likely to honeymoon (44%).
- Registry: Brides in West North Central are the most likely to register for wedding gifts (94%), while Mountain brides are least likely to register (84%).*
*Middle Atlantic is comprised of NY, NJ, PA
*East South Central is comprised of AL, TN, KY, MS
*West North Central is comprised of MO, KS, IA, ND, NE, SD, MN
*Mountain is comprised of CO, AZ, NV, UT, ID, MT, NM, WY
Top 8 2012 Wedding Trends
BOOMING BUDGETS. Brides are spending even more on their weddings. Following 2011’s trend of growing budgets, for the second year in a row since the economic downturn, the average wedding spend has grown year over year, hitting $28,427, the highest level since 2008. In this vein, fewer brides (26%) say the economy affected their wedding spend – a statistic that has continually decreased year over year, from 29% in 2011, 31% in 2010 and 34% in 2009. Wedding standards also continue to rise, as the average wedding spend per guest increased to $204, as compared to $196 in 2011 and even $194 in 2009. In fact, about 1 in 8 brides (13%) are spending more than $40,000 on their nuptials, and nearly 1 in 4 (23%) didn’t even have a budget. It is important that sourcing a wedding photographer Boerne is high on your priorities irrespective of your budget.
YEAR OF THE GUEST. Brides are concentrating on creating an experience for guests. Not only did spend per guest increase to$204, up almost $10 per guest from 2011, when brides spent $196 per guest, but also guest entertainment continues to gain popularity. This rapidly rising category only continues to grow – in 2012, more than 1 in 4 brides (27%) provided additional guest entertainment, compared to just 22% in 2011, 15% in 2010 and 11% in 2009. Additionally, while the number of brides who throw a rehearsal dinner, after-party or morning-after brunch has remained steady, brides are spending more money on these events. In 2012, brides spent an average of $1,135 on their rehearsal dinners (up from $1,078 in 2011) and $429 on their morning-after brunch (up from $416 in 2011). More than 1 in 4 (27%) are even providing shuttles and buses for guests to attend their weddings.
SAME-SEX WEDDINGS. First-ever same-sex wedding statistics released. Same-sex couples have longer engagements and are older at the time of their weddings, compared to traditional couples. They’re more likely to have a casual wedding and report having fewer wedding guests. Same-sex couples spent slightly more on their overall wedding costs and more per guest. They’re also less likely to host a bridal shower, bachelorette or bachelor party, but more likely to have an after-party, engagement party and couples party.
LESS-FORMAL STYLE. Casual and fun weddings grow. Wedding style continues to move toward the more casual end of the spectrum. In 2012, approximately 1 in 6 (17%) of brides said their wedding style was “casual,” compared with 16% in 2011, 14% in 2010 and 12% in 2009. Throughout the past several years, brides have increasingly described themselves in less formal ways, as well. “Fun” was the number one descriptor chosen, with more than 1 in 4 (27%) brides describing themselves this way. Additionally, 1 in 4 described themselves as DIYers, compared with just 17% in 2008. “Elegant,” which was the number one descriptor in 2008, when 31% of brides chose it, continues to decline, falling to just 22% in 2012.
WEDDINGS LESS RELIGIOUS. Number of weddings taking place in religious institutions declining. In hand with the move toward more-casual weddings, religious institutions are chosen less frequently for the wedding ceremony. Only 35% of brides opted to hold their wedding in a house of worship in 2012, down from 2 in 5 (41%) in 2009. Additionally, more couples are opting to have a friend or family member officiate the ceremony. In 2012, 1 in 3 (33%) couples chose a friend or family member to officiate, up from 31% in 2011 and 2010, and 29% in 2009.
HONEYMOONS ARE HAPPENING. Honeymoon planning is less affected by economy. For the past several years, brides reported that due to the economy, they were opting to postpone their honeymoons to keep wedding budgets in check. In 2009, 82% of couples took a honeymoon, compared to 77% in 2011. For the first time since 2009, this number remains steady and is no longer declining; in 2012 more than 3 in 4 couples (77%) took a honeymoon. As we see the economy’s effect on wedding planning continue to lessen, the impact on honeymoons continues to lessen too.
BRIDES HAVE THE BLUES. Blue is the most popular wedding color. Blue has gained popularity in recent years, with 1 in 3 (33%) brides opting for the hue. Dark blue has actually doubled in popularity since 2008, when only 10% chose the color, compared to 20% selecting it in 2012. Purple continues to be popular, with 22% picking purple in 2012. Gray is also gaining steam, with 11% choosing the color in 2012, up from only 7% in 2011.
SAVING THE DATE. More couples opting for Save-the-Dates. In 2012, couples were more conscious of their guests and chose to send save-the-dates more than in past years – nearly 7 in 10 (68%) sent save-the-dates compared to 57% in 2009. Brides are also opting more for professionally made save the dates, as well. Two in five couples (40%) sent them, compared to just 29% in 2009. Electronic save-the-dates are also popular: 28% created and/or sent save-the-dates online, compared to just 19% in 2009.
About TheKnot.com & WeddingChannel.com 2012 Real Weddings Survey
The 2012 Real Weddings Survey captured responses from nearly 17,500 US brides married between January 1 and December 31, 2012; respondents were recruited throughout the year from TheKnot.com and WeddingChannel.com membership, which represents nearly 80% of brides nationwide. Brides received survey invitations shortly after their wedding date and were asked a comprehensive series of questions about the event and their planning process. All qualified respondents attested that they:
- Were 18 or older
- Had a wedding in 2012
Survey respondents represent a variety of ethnicities and educational and income levels, and are geographically dispersed across the country. The survey and data management partner for the study was Decipher Inc.




Join the Conversation →