Cost of US Weddings Reaches New High as Couples Spend More Per Guest to Create an Unforgettable Experience, According to The Knot 2016 Real Weddings Study
The largest survey of Americans married in 2016 unveils couples are spending more, and going over budget, on guest entertainment including musical performances, games and even aerialists. Since finding things like a good colorado wedding dj is so important for weddings these days, these financial trends are likely to show no signs of stopping anytime soon.
NEW YORK, NY/February 2, 2017 – The Knot, the leading wedding brand and marketplace, today released the results of The Knot 2016 Real Weddings Study. The 10th annual comprehensive report, the largest of its kind, surveyed nearly 13,000 US brides and grooms married in 2016 to uncover the financial spending habits and trends of real weddings in America. This study includes national and regional statistics on the average cost of a wedding, wedding vendor cost, how couples budget for their big day, the average number of wedding guests, spend per guest, wedding style trends and other key statistics related to weddings in America.
In 2016, the average cost of a wedding reached an all-time high at $35,329, while the number of guests dropped. That correlation means spend per guest increased, showing that couples are spending with a focus on guests. Custom guest entertainment has more than tripled, from 11% to 41% since 2009, with photo booths (78%), games (18%), musical performances (12%) and fireworks (8%) at the top of the list. The importance of Wedding Entertainment is hard to understate and this is clear looking at the findings. Not only are guests being entertained at weddings, but this year couples reported that nearly 20% of their guests hooked up at or after their wedding.
“Wedding spend continues to rise, but at the same time, guest lists are shrinking as couples spend more per guest to create an unforgettable experience for those closest to them,” said Kellie Gould, editor in chief of The Knot. “Couples are also using their wedding day to make their first big statement as a couple. From invitations to the reception band, couples are spending more to put their personal stamp on every detail.”
Top 2016 Wedding Statistics
Average Wedding Cost: $35,329 (excludes honeymoon) (up from $32,641 in 2015)
Most Expensive Place to Get Married: Manhattan, $78,464 average spend
Least Expensive Place to Get Married: Arkansas, $19,522 average spend
Average Spent on a Wedding Dress: $1,564
Average Marrying Age: Bride, 29 ; Groom, 31
Average Number of Guests: 141
Average Number of Bridesmaids: 5
Average Number of Groomsmen: 5
Most Popular Month to Get Engaged: December (15%)
Average Length of Engagement: 15 months
Most Popular Month to Get Married: October (16%) and September (16%)
Popular Wedding Colors: Dark blue (29%), gold (28%) and light pink (28%)
Percentage of Destination Weddings: 20%
Top 2016 Wedding Trends
GUEST EXPERIENCE IS TOP OF MIND AS GUEST SPEND RISES WHILE GUEST COUNT DROPS. Showing just how much couples are focused on creating the ultimate guest experience, the average number of wedding guests in 2016 is down to 141, compared to 149 in 2009, while the cost per wedding guest is up to $245, compared to $194 in 2009. To create a completely memorable experience for guests, couples are amping up the entertainment and personalization. Seventy-five percent of all couples have at least one signature wedding element (up from 66% in 2008), such as a signature cocktail (24%). Custom guest entertainment has more than tripled, from 11% to 41% since 2009, with photo booths (78%), games (18%), musical performances (12%) and fireworks (8%) at the top of the list. Also on the rise are cigar rolling stations, wine and liquor tastings and dance performers. Don’t be surprised to see aerialists, acrobats, live painters or gospel choirs this year as 2017 wedding trends reach new heights in guest entertainment.
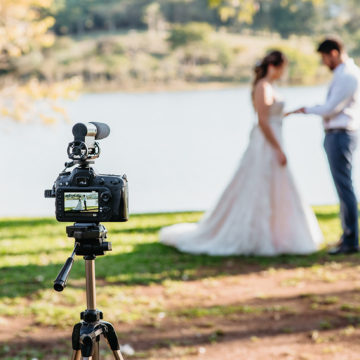
WED TECH HELPS CAPTURE EACH AND EVERY MOMENT. As technology has become a part of our everyday lives, 22% of couples incorporated some type of technology into their wedding day including: GoPros in bridal bouquets to capture the walk down the aisle, drones to take aerial wedding footage and live streaming video to share the wedding day with loved ones who couldn’t attend. Sixty-four percent of couples created a wedding hashtag and shared with guests on their personalized wedding website (48%), table tent cards (32%), ceremony program (20%) and wedding invitation (19%).
COUPLES ARE SPENDING OVER PLANNED BUDGETS WHILE PARENTS TAKE ON MOST OF THE WEDDING COSTS. Tradition rings true with parents paying for a majority of today’s weddings. On average, the bride’s parents contribute 44% of the overall wedding budget, the bride and groom contribute 42%, and the groom’s parents contribute 13% (others account for the remaining 2%). In 2016, 10% of couples paid for the wedding entirely by themselves, and 8% of couples didn’t contribute any finances to the wedding budget. Most couples (89%) say the economy did not affect wedding plans and 47% (up from 42% in 2011) report spending more than they planned for.
MOBILE WEDDING PLANNING DOUBLES AS MORE COUPLES ARE PLANNING ON THE GO. In 2016, couples using smartphones for wedding planning activities more than doubled from 42% in 2014 to 90% in 2016. The most popular mobile wedding planning activity: browsing wedding gowns (62%). Researching wedding vendors (51%, up from 31% in 2014), using online planning tools (43%, up from 21% in 2014), creating a personal wedding website (25%, up from 14% in 2014) and using an online RSVP service (20%, up from 7% in 2014) are also top of mind wedding activities on mobile.
HOOK UPS AND GETTING DRUNK, OH MY. Looking for a love match? You may just find one at the next wedding you attend. Nineteen percent of couples say some of their guests hooked up during or after their wedding, with 4% reporting that guests who met at their wedding are now in a committed relationship. Guests aren’t the only ones indulging in reception libations. Fifteen percent of brides admit they got drunk at their wedding and 18% say their groom got drunk as well.Nine percent of brides reported that she, or both her and her significant other, had an ex-lover at their wedding. Four percent of survey respondents admitted that their best man insulted someone during his toast.
LOCATION, LOCATION, LOCATION. Ceremony and reception locations are becoming even more important as couples plan a personalized wedding that’s a true reflection of their personalities and relationship together. Forty-eight percent said that having a reception venue with a scenic backdrop or locale was the top priority, while having both an indoor and outdoor space was most important for 30% of couples. New Jersey in the fall can be an especially sought after location for weddings. As unexpected places to wed are on the rise, only 26% had a ceremony in a religious institution (down from 41% in 2009). Hosting weddings at farms, barns and ranches increased from 2% in 2009 to 12% in 2016, and historic buildings and homes rose in popularity from 9% in 2009 to 13% in 2016. Other popular non-traditional ceremony sites include beach houses, public gardens, wineries and museums.
COUPLES CONTINUE TO WED FAR FROM HOME. Only 20% of couples considered their wedding a destination wedding, down from 24% in 2011. Of those who had a US destination wedding, 49% got married 200 miles or more from where they lived at the time of their wedding. Nearly 13% of destination wedding couples host a second party when they return home for friends and family who weren’t able to attend. There are more than 340,000 destination weddings each year with 89% (up from 77% in 2015) taking place in the continental US and 11% (down from 23% in 2015) at international destinations. Top locales include Hawaii (35%), California (14%), Florida (12%), Caribbean (27%) and Mexico (10%). If you want to hold a destination wedding abroad then they not check out this list on the Top 25 Barcelona Wedding Venues to get some ideas for where to go!
FALL WEDDINGS DOMINATE. Summer weddings still remain a popular season to say “I do,” but fall has taken the top spot with 40% (up from 30% in 2009) of couples hosting their nuptials in the fall months. September and October are tied for the most popular month, each accounting for 16% of weddings, followed by June with 13%. Saturday nuptials are still strong at 70% followed by Fridays (14%) and Sundays (12%).
Top 25 Most Expensive Places to Get Married
Based on average cost of a wedding in 2016, couples spend the most on their weddings in the following areas in the US. Four of the five most expensive places to get married are in the New York/Tri-State area.
New York – Manhattan: $78,464
New York – Long Island: $67,831
New Jersey – North/Central: $62,606
Illinois – Chicago: $60,035
New York – Outer Boroughs: $59,027
Massachusetts – Cape Cod: $58,608
New York – Westchester/Hudson Valley: $54,428
Rhode Island: $52,328
Florida – Southern: $48,596
Pennsylvania – Philadelphia/Delaware: $48,093
New Jersey – South: $46,486
California – Santa Barbara/Ventura: $45,957
California – Los Angeles: $44,062
Massachusetts – Boston: $44,028
California – San Francisco/Greater Bay Area: $42,716
Louisiana – New Orleans: $42,628
Connecticut: $42,127
Texas – Houston/East TX: $40,285
DC – Washington DC/Northern VA/Suburban MD: $40,176
California – San Diego: $37,268
Texas –Austin/San Antonio/South TX/Central TX: $36,522
Maryland – Baltimore: $35,861
Michigan – Detroit: $35,576
California – Orange County: $35,303
NY – Capital District/Upstate NY: $34,874
Top 10 Most Affordable Places to Get Married
Based on average cost of a wedding in 2016, couples spend the least on their weddings in the following areas in the US.
Arkansas: $19,522
Utah: $20,337
Montana: $20,794
Texas – West Texas: $21,688
Oregon: $21,854
Idaho: $22,018
Arizona – Tucson: $22,175
Iowa: $23,098
Nevada: $23,239
Oklahoma: $23,302
2016 Average Wedding Budget Breakdown
Figures based on respondents who hired a professional vendor for the service.
Category 2016 National Average Spend 2015 National Average Spend
Overall Wedding (excluding honeymoon) $35,329 ? $32,641
Venue (reception hall) $16,107 ? $14,788
Photographer $2,783 ? $2,618
Wedding/Event Planner $2,037 ? $1,996
Reception Band $4,156 ? $3,833
Reception DJ $1,245 ? $1,171
Florist/Décor $2,534 ? $2,300
Videographer $1,995 ? $1,824
Wedding Dress $1,564 ? $1,469
Groom’s Attire and Accessories $280 ? $269
Wedding Cake $582 ? $575
Ceremony Site $2,197 ? $2,089
Ceremony Musicians $755 ? $703
Invitations $462 ? $445
Transportation $859 ? $792
Favors $268 ? $267
Rehearsal Dinner $1,378 ? $1,296
Engagement Ring $6,163 ? $5,871
Catering (price per person) $71 ? $68
Officiant $278 ? $273
Notable Regional Differences
The Knot 2016 Real Weddings Study can be broken down on a region-by-region basis across more than 80 markets. Regional highlights include:
Cost of Weddings: Manhattan, New York, and Long Island, New York, have the highest average wedding spend ($78,464 and $67,831, respectively), and Arkansas and Utah have the lowest average wedding spend ($19,522 and $20,337 respectively), excluding honeymoon.
Marriage Age: New York City accounts for the country’s oldest brides, with Manhattan brides being 31.7 years old on average, and brides from Southern Florida being an average of 31.2 years old. Whereas Alabama and Tucson, Arizona, have the youngest brides (26.5 and 26.7 years, respectively), on average. The country’s oldest grooms can be found in Manhattan (34.4 years old) and Southern Florida (33.1 years old), and the youngest grooms are in Alabama and Utah (27.9 and 28.2 years, respectively).
Engagement Length: Couples from Orange County, California and Lehigh Valley/Poconos, Pennsylvania, have the longest engagements (20.5 and 19.3 months, respectively), while couples in Utah and Mississippi walk down the aisle a bit sooner after getting engaged (8.5 and 11 months, respectively), on average.
Wedding Size: Nebraska and Iowa couples have the largest number of wedding guests (230 and 210, respectively), and couples who tie the knot in Hawaii and Nevada still have the smallest number of wedding guests (74 and 84, respectively).
Wedding Style: Hawaii and Montana weddings are more likely to be casual than any other region in the US (44% and 39%, respectively), while Long Island and North/Central New Jersey have the most black tie weddings (40% and 38%, respectively).
Wedding Dress Spend: As in 2015, brides in Manhattan and Long Island still spend the most on their wedding gowns ($2,564 and $2,473, respectively), while Nevada and Oregon brides spend the least ($1,074 and $1,171, respectively).
Honeymoon: Couples from Alabama (89%), Mississippi (89%), Toledo, Ohio (87%) and Tennessee (87%) are most likely to book a honeymoon, while couples in Montana (33%), Nevada (60%) and Hawaii (61%) are least likely to book a honeymoon.
Gift Registry: Couples in Nebraska and Alabama are most likely to register for wedding gifts (98% and 96%, respectively), while couples in Nevada and Hawaii are least likely to register (66% and 70%, respectively).


Join the Conversation →